Sample reports
Brand report
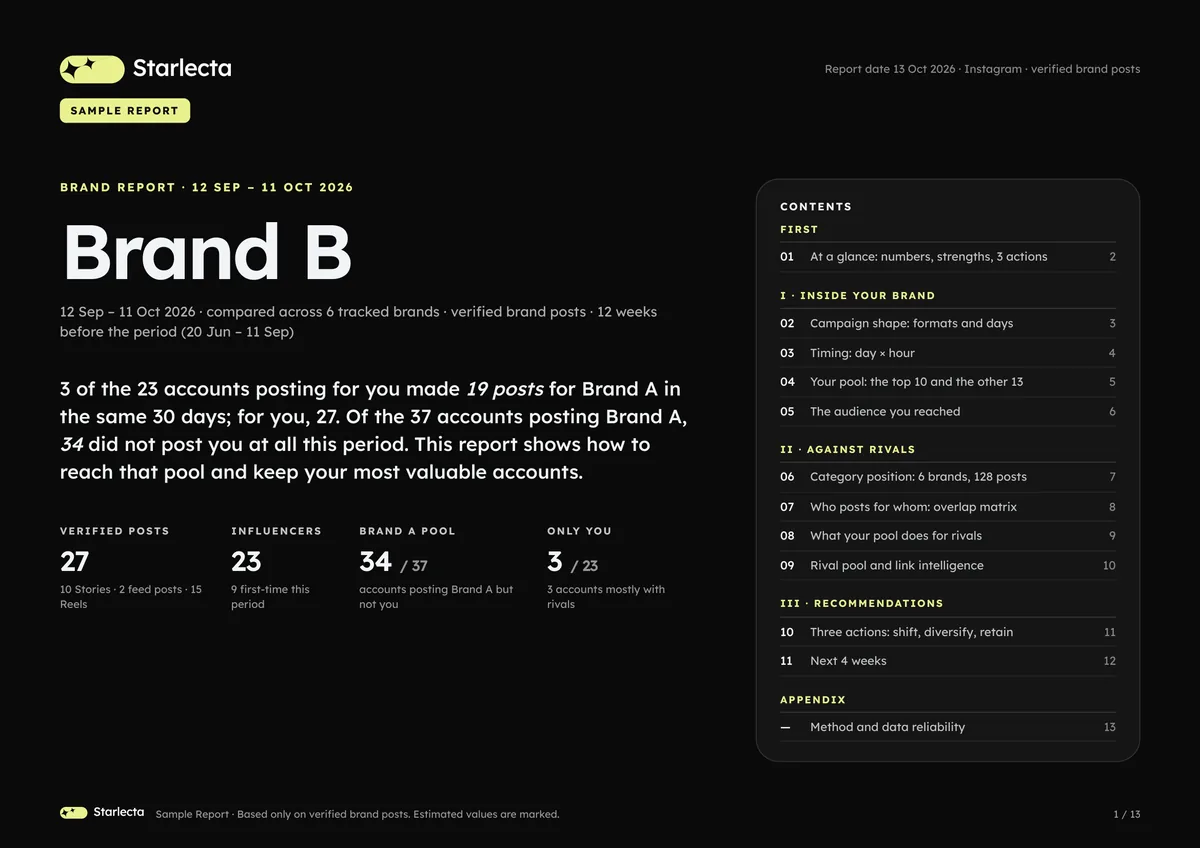
One brand's 30 days on Instagram, compared across six tracked brands.
- Period
- 12 Sep to 11 Oct 2026 (30 days), compared with the 12 weeks before
- Scope
- 6 tracked brands, Instagram, verified brand posts
- In the sample
- 27 verified brand posts, 23 influencers, 85 possible posts left out for lack of evidence
- Length
- 13 pages, PDF
The question it answers
Which influencers post for my brand, how does that pool compare with my rivals' pools, and which accounts should I keep or add?
How it is produced
- Only verified brand posts are counted. A post is verified by a verified brand link or by caption or tag evidence; in this sample 0 posts had a link and all 27 had caption or tag evidence. Rival posts are verified with the same method in the same period.
- First-time and returning accounts are based on the 12 weeks before the period.
- Visibility: for Reels, the plays reported by the platform (gross plays, not unique reach). For feed posts and Stories the platform reports no such number, so the value is estimated and marked as an estimate.
- Engagement: likes plus comments on feed posts and Reels when readable. When likes are hidden, followers multiplied by the engagement rate. For Stories, estimated views multiplied by the Reel engagement per view.
- Measured and estimated values are shown separately and never added into one number.
- Audience similarity compares measurable audience profiles. It is not shared followers.
What the sample shows
Campaign shape by format and day, timing by day and hour, the top 10 accounts of the pool and the rest, the audience reached, the category position among six brands, an overlap matrix of who posts for whom, what the pool does for rivals, and three recommended actions for the next four weeks. The last page repeats the method and data reliability.
Limits
- It covers accounts tracked by Starlecta, not all of Instagram.
- Estimated Story values are modelled, not measured views.
- Engagement is computed for the posts where the needed counters exist; the report says for how many.
The key question, on this page
How were this brand's 27 verified posts split by format, and what part of the visibility is measured?
| Format | Posts and share |
|---|---|
| Stories | 10 posts · 37% |
| Feed posts | 2 posts · 7% |
| Reels | 15 posts · 56% |
One of six tracked brands, Instagram, verified brand posts. Bars show each format's share of the posts. Measured visibility is 157K; the 1.72M Story views are an estimate.
Finding. Reels and Stories carry 25 of the 27 verified posts. Measured visibility is 157K. The 1.72M Story views are an estimate from similar accounts, shown on a separate line and never added to the measured number.
View the PDF (Brand report, opens in a new tab)
Results are limited to Starlecta's tracked accounts, the selected period and the available content evidence. Observed metrics and Story estimates are shown separately.
Download
13 pages · PDF · The PDF is in English.
Anonymized sample. Brand, influencer and campaign names are replaced and images are pixelated.
© 2026 Starlecta. All rights reserved. Content, data and reports on this site may not be copied or redistributed without written permission.
Definitions as of 24 October 2026
Book a demo