Sample reports
Competitive analysis: Food & beverage
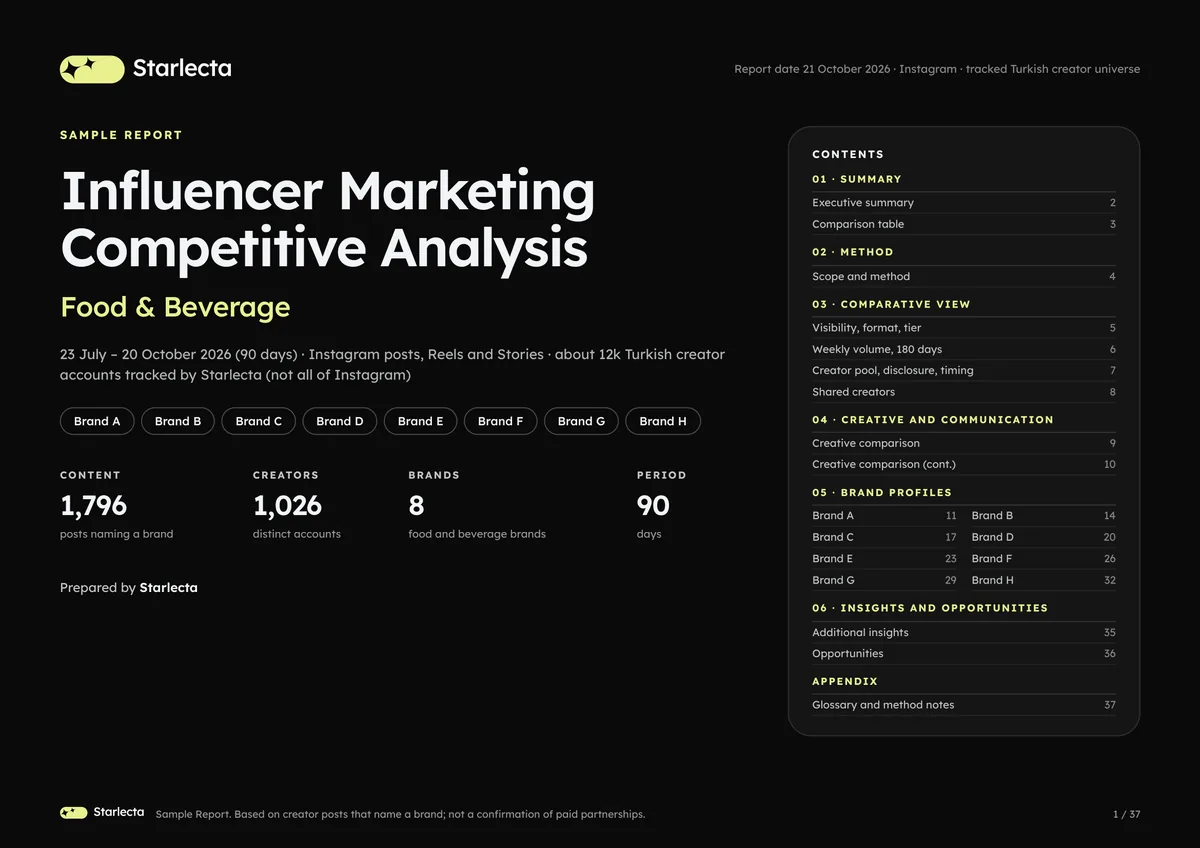
Eight food and beverage brands over 90 days, compared side by side.
- Period
- 23 Jul to 20 Oct 2026 (90 days); weekly trend from a 180-day series
- Scope
- 8 food and beverage brands, Instagram feed posts, Reels and Stories
- In the sample
- 1,796 content items from 1,026 distinct accounts
- Length
- 37 pages, PDF
The question it answers
How do the brands in my category compete on Instagram: how visible are they, in which formats and with which influencers, what do they say, and where is the space nobody uses?
How it is produced
- Data source: Turkish Instagram influencer accounts tracked continuously by Starlecta (not all of Instagram); feed posts, Reels and Stories.
- Brand matching uses brand and sub-brand account tags (@), hashtags and brand names in captions. A post naming more than one brand is counted once per brand.
- Media analysis: unique creatives were analysed visually (images directly, videos by their opening frame and a 4-frame summary). Speech in videos was transcribed; communication language comes from these transcripts and the captions. Each creative was classified by content type, tone, product placement, setting, whether the influencer is on camera, call to action and occasion.
- Ad disclosure is the share of feed posts and Reels with an ad tag (#ad, #collab, #promo and Turkish equivalents). It is a declared tag, not proof of payment.
- Views are gross plays and exist for Reels only. Engagement rate is (likes + comments) divided by followers, as a median over feed posts and Reels.
What the sample shows
A comparison table, share of visibility by brand, format mix and follower tier, influencer overlap, creative comparison, a profile per brand and a closing section on insights and opportunities.
Limits
- The universe is not all of Instagram; absolute volumes are lower bounds. The number of tracked accounts grew over the 180 days, so weekly trends are directional.
- In the externally observed data this report can access, Stories have no measured views, engagement or caption text, so ad disclosure and performance use feed posts and Reels only.
- Brands with small samples are flagged and their ratios are directional only.
- A brand mention is not proof of a paid collaboration.
The key question, on this page
Which brand has the most influencer content in the category, and how large is its lead?
| Brand | Items and share |
|---|---|
| Brand A | 1,143 items · 63.3% |
| Brand B | 199 items · 11.0% |
| Brand C | 175 items · 9.7% |
| Brand D | 138 items · 7.6% |
| Brand E | 107 items · 5.9% |
| Brand F | 23 items · 1.3% |
| Brand G | 12 items · 0.7% |
| Brand H | 9 items · 0.5% |
Tracked Turkish influencer accounts, 90 days, 1,806 brand assignments; an item naming more than one brand is counted once per brand. Bars show the share. This is a content count, not performance. Brands F, G and H are small samples.
Finding. Brand A leads with 1,143 items from 806 influencers, and 90% of its items are Stories. Stories have no measured views or engagement in this data, so engagement rates use feed posts and Reels only.
View the PDF (Competitive analysis: Food & beverage, opens in a new tab)
Results are limited to Starlecta's tracked accounts, the selected period and the available content evidence. Observed metrics and Story estimates are shown separately.
Download
37 pages · PDF · The PDF is in English.
Anonymized sample. Brand, influencer and campaign names are replaced and images are pixelated.
© 2026 Starlecta. All rights reserved. Content, data and reports on this site may not be copied or redistributed without written permission.
Definitions as of 24 October 2026
Book a demo