Sample reports
Influencer report
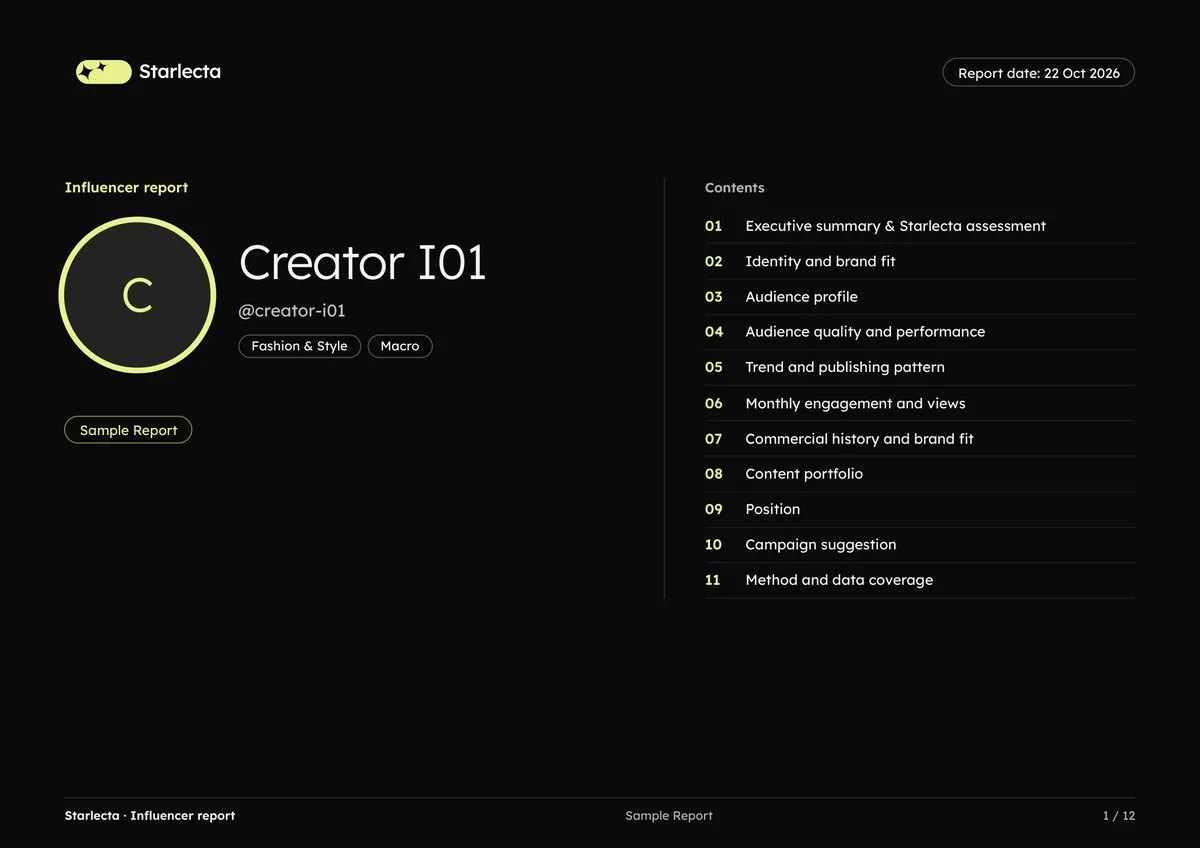
One influencer in depth, with every number labelled stored, actual, estimated or peer-modelled.
- Window
- Last 180 days of content; data as of 22 Oct 2026
- Scope
- One influencer, Instagram
- In the sample
- SQS 87, overall engagement rate 4.02%, Reel engagement rate 2.86% (sample values; large numbers rounded to 2 significant figures)
- Length
- 12 pages, PDF
The question it answers
Is this influencer a good fit for my brand: who is the audience, how real and engaged is it, how has performance moved, and what is the commercial history?
How it is produced
- Each number carries a label. Stored: a measurement calculated daily and stored in the system. Actual counter: taken from the real counter the platform returns. Estimate: modelled from the account's own history. Peer model: modelled from the median of similar accounts.
- Views are gross plays, not unique reach. Actual counters and estimates are labelled separately and never added together.
- The SQS and its seven components are read from the stored score. The report lists weights, points per component and data coverage.
- Audience percentages come from engaged commenters; the follower list is not scanned. Comments are capped at 1,000 per content item and all stored unique commenter IDs are compared, with no random sampling or extrapolation.
- Commercial classes are separate: declared ad (the account's own disclosure wording), paid partnership (the platform's official label), other commercial signal (a product or brand link or a known brand tag), declared not an ad, and no commercial signal found.
What the sample shows
An executive summary with the stored scores, identity and brand fit, audience profile, audience quality and performance, publishing pattern, monthly engagement and views, commercial history, content portfolio, position among peers, audience overlap and campaign, and a closing method page.
Limits
- A Story estimate comes from the peer median view ratio, not from the account's own Reels.
- Non-ad means no ad marker was found; it does not guarantee the content is non-commercial. A disclosure is not proof of payment.
- Shared engaged people are a commenter overlap, not shared followers.
The key question, on this page
How is this influencer's SQS of 87 built from its seven components?
| Component | Points |
|---|---|
| Engagement rate | 23.6 of 25 |
| Story activity | 16.9 of 20 |
| Real audience | 10.2 of 15 |
| Recency | 15.0 of 15 |
| Loyal commenters | 8.1 of 10 |
| Growth | 9.1 of 10 |
| Positive sentiment | 4.2 of 5 |
Last 180 days of content, data as of 22 Oct 2026, data coverage 100%. Each bar shows the points as a share of the component's maximum. The seven contributions add up to the SQS of 87.
Finding. Engagement on non-ad content is 3.09% against 2.10% on ad content (actual counters). Non-ad means no ad marker was found, and a disclosure is not proof of payment.
View the PDF (Influencer report, opens in a new tab)
Results are limited to Starlecta's tracked accounts, the selected period and the available content evidence. Observed metrics and Story estimates are shown separately.
Download
12 pages · PDF · The PDF is in English.
Anonymized sample. Brand, influencer and campaign names are replaced and images are pixelated.
© 2026 Starlecta. All rights reserved. Content, data and reports on this site may not be copied or redistributed without written permission.
Definitions as of 24 October 2026
Book a demo